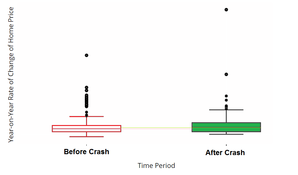
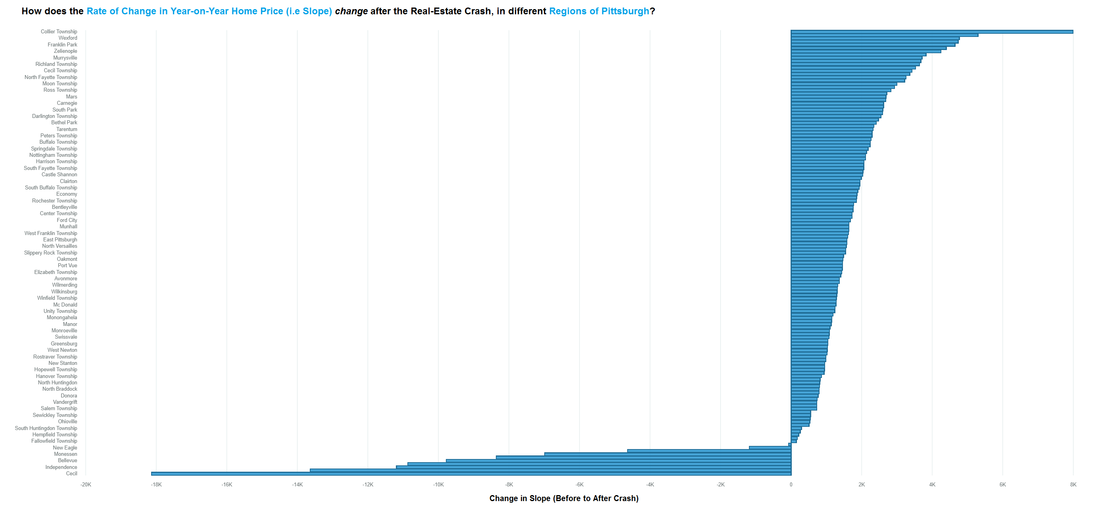
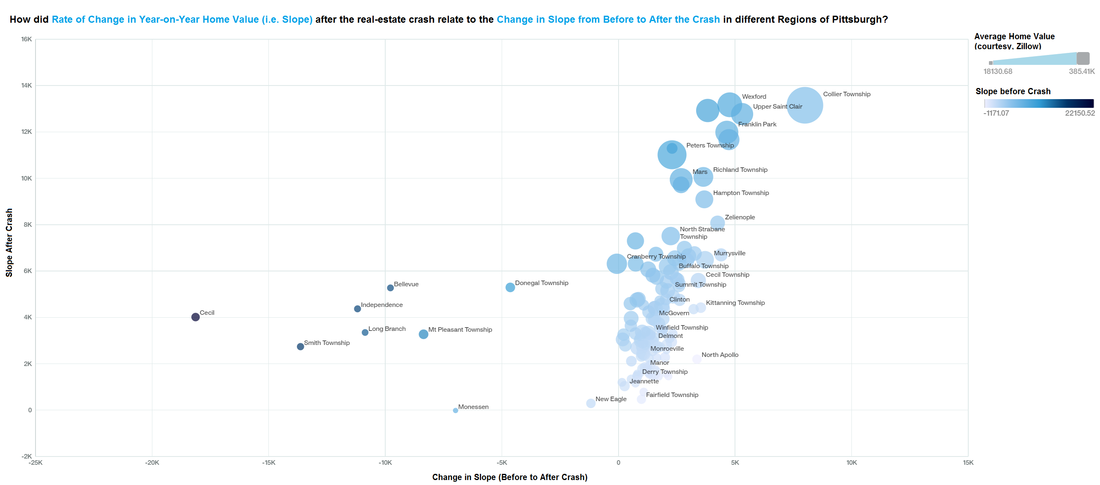
But this can't be right, per common knowledge, can it? I thought the market was doing better of-late, given the skyrocketing home prices these days. A colleague and mentor of mine once told me that a limited dataset will confess to anything if interrogated sufficiently. So, I decided to tear the data apart a little bit more to make it confess to what I wanted it to tell me. Onward to Exhibit #2 (see below; click to zoom in):
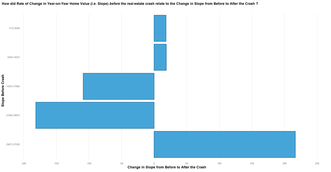
In summary, it appears that the regions which did poorly (i.e. either getting lower in value from year-to-year or pretty much changing by very small dollar amounts per year, before the Crash) began doing a whole lot better after 2009, with significantly increasing home values every year (see summary plot below), whereas all the so-called "Healthy" areas before the crash began losing in value every year (i.e. negative Slopes!) after 2009 - mind boggling, right? Ah, but one group of elite regions before the crash did hold its own and surpassed other regions in terms of growth in value after 2009 - which one was this? Alas, the rich tend to always grow richer and the best performers since 2009 were also the best performers in terms of year-on-year home value before Dec 30, 2008. So, it pays to go big when you're buying your "forever home"!


 RSS Feed
