
This afternoon I had a chance to access a dataset curated from Zillow data from which it was possible to compute average home prices for several regions in the Greater Pittsburgh Area. Given that this data was available from 1996 onward to 2017, naturally I was curious to see whether the average home prices have in-fact increased across all regions in the area, considering years leading up to the real-estate crash of 2008. To remind those unfamiliar with this event, on December 30, 2008, the Case-Shiller home price index reported its largest price drop in its history. The unique dataset at my disposal this afternoon formed the ideal platform to truly examine the effects of the crash on Pittsburgh, PA. The plot on the Left compares the year-on-year rate of change of average home price (i.e. the "Slope" of average home price, measured in "$ per year" - a term we will use throughout the remainder of this blog post) in all regions put together, leading up to Dec 30, 2008 and after the crash (i.e. considering trends from 2009 to 2017).I'll have to say I was a little disappointed to see such a marginal increase in the Slope of year-on-year average home value - while there was an improvement, it was hardly statistically significant when the entire cohort is considered.
But this can't be right, per common knowledge, can it? I thought the market was doing better of-late, given the skyrocketing home prices these days. A colleague and mentor of mine once told me that a limited dataset will confess to anything if interrogated sufficiently. So, I decided to tear the data apart a little bit more to make it confess to what I wanted it to tell me. Onward to Exhibit #2 (see below; click to zoom in):
But this can't be right, per common knowledge, can it? I thought the market was doing better of-late, given the skyrocketing home prices these days. A colleague and mentor of mine once told me that a limited dataset will confess to anything if interrogated sufficiently. So, I decided to tear the data apart a little bit more to make it confess to what I wanted it to tell me. Onward to Exhibit #2 (see below; click to zoom in):
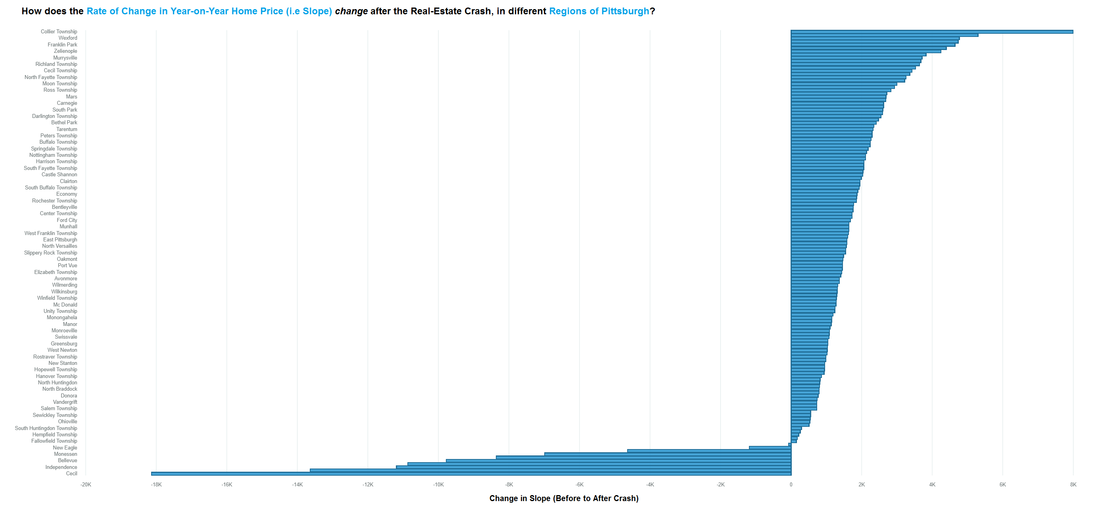
From the plot above, which describes the change in Slope of average home value by region from before Dec 30, 2008 to after this point in time (viz. the X-axis), it seems quite clear that there were several regions in the Greater Pittsburgh Area which did in-fact start improving in region-average home price after the crash of 2008 - but some better than others. Contrary to common thought, there were a host of regions which actually started doing "worse" after 2009 than they were doing before the crash. What in the world did these regions have to do in order to accomplish this? Lets find out! In the plot below, I examine how the year-on-year rate of change in home value (i.e. the Slope) after the crash relates to the change in Slope from before the crash to after the crash, such that each circle in the plot below represents a region, the size of which is equivalent to the relative average home value in that region. Further, to add information to this plot, the plotted circles are heat-mapped from light-blue to black in increasing order of Slope of year-on-year home value "before" the crash. So, what does this tell us?
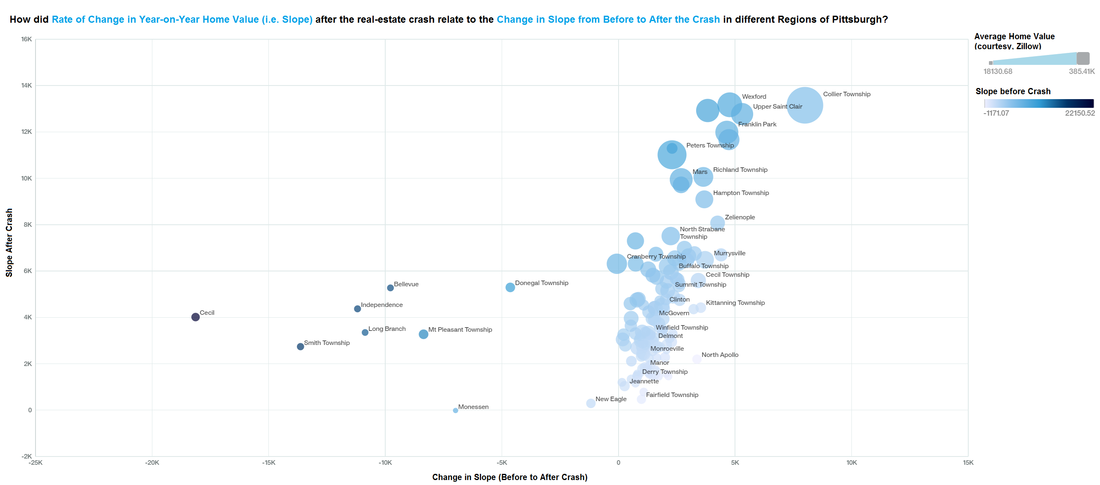

Well, it appears as though the regions which were actually doing well up until the crash of 2008 started doing really poorly with a year-on-year decrease in average home value after the crash! Au contraire, not all the regions which were doing badly before the crash started doing particularly well (in terms of slope i.e. year-on-year increase in average home price) after 2009. What is clear however is that the largest circles in the plot i.e. the regions which have the highest region-average home value today also correspond with those regions which were mid-range in terms of Slope of home value over time before the crash (i.e. light blue) but also experienced the largest change in Slope from before to after the crash of 2008 (i.e. they're on the far right of the plot above - including, Peters Township and Upper St Clair in the South of Pittsburgh, and Franklin Park and Wexford in the North)! Oh, how the times change!
In summary, it appears that the regions which did poorly (i.e. either getting lower in value from year-to-year or pretty much changing by very small dollar amounts per year, before the Crash) began doing a whole lot better after 2009, with significantly increasing home values every year (see summary plot below), whereas all the so-called "Healthy" areas before the crash began losing in value every year (i.e. negative Slopes!) after 2009 - mind boggling, right? Ah, but one group of elite regions before the crash did hold its own and surpassed other regions in terms of growth in value after 2009 - which one was this? Alas, the rich tend to always grow richer and the best performers since 2009 were also the best performers in terms of year-on-year home value before Dec 30, 2008. So, it pays to go big when you're buying your "forever home"!
In summary, it appears that the regions which did poorly (i.e. either getting lower in value from year-to-year or pretty much changing by very small dollar amounts per year, before the Crash) began doing a whole lot better after 2009, with significantly increasing home values every year (see summary plot below), whereas all the so-called "Healthy" areas before the crash began losing in value every year (i.e. negative Slopes!) after 2009 - mind boggling, right? Ah, but one group of elite regions before the crash did hold its own and surpassed other regions in terms of growth in value after 2009 - which one was this? Alas, the rich tend to always grow richer and the best performers since 2009 were also the best performers in terms of year-on-year home value before Dec 30, 2008. So, it pays to go big when you're buying your "forever home"!

 RSS Feed
